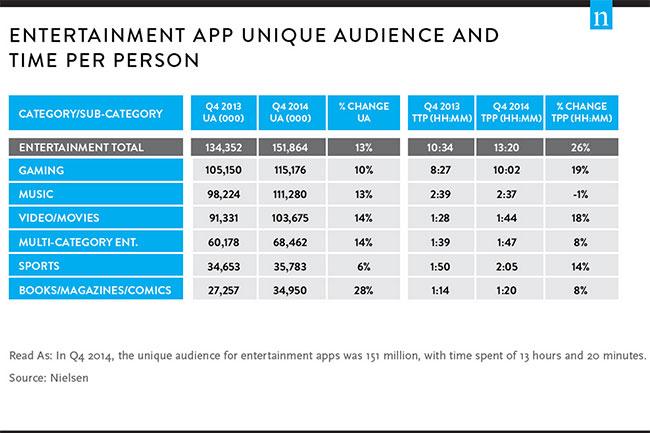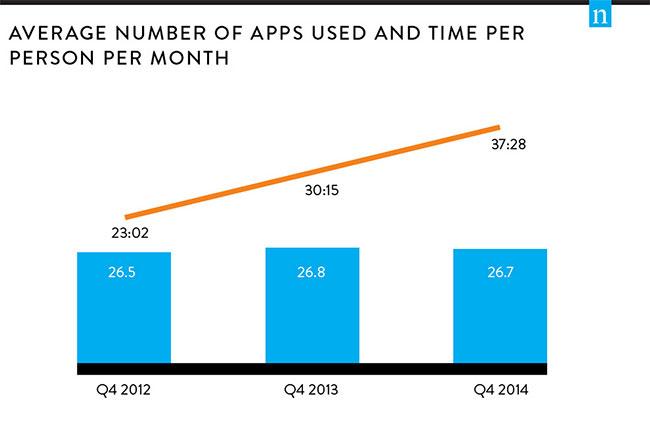
Although monthly app use doesn’t seem to be increasing, the time spent in each app is skyrocketing. In the past two years, the time consumers spent engaging with select apps has increased by a whopping 63 percent.
Nielsen says the most popular category of apps is “entertainment,” but this includes apps like mobile games, weather apps, ebooks, and sports apps. In Q4 2014, the gaming subcategory, saw the highest usage of any app type in the entertainment app sector. On average, mobile users spent 10 hours and 2 minutes playing games each month. Of course, apps that stream music, videos, and movies follow right behind the games subcategory.
The increase in entertainment app usage is staggering, and the trend also crosses over into overall app use. Back in 2012, consumers spent more than 23 hours engaging with their favorite apps in the four quarter alone. During the same timeframe in 2014, app use reached 37 hours and 28 minutes. The new figure marks a substantial increase, and it indicates that users are engaging with certain apps repeatedly over time.
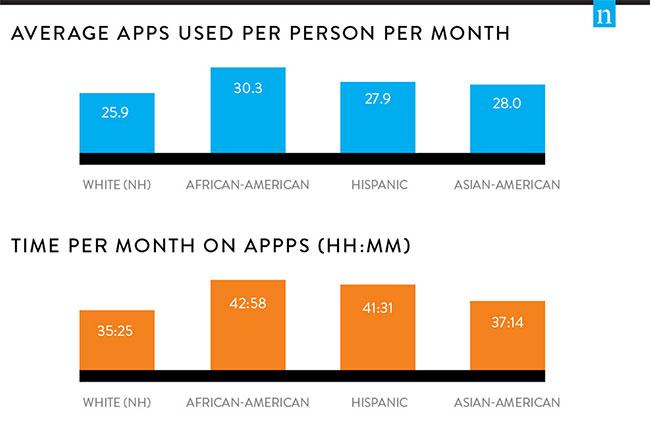
However, increased app usage seems to have only affected a few chosen apps. Just last summer, Nielson reported the number of apps being used has only slightly increased over the past few years. When it comes to comparing recent numbers by gender, it turns out that men use 27.2 apps per month and women use 26.3 apps per month.
Nielsen’s data comes from a willing group of 5,000 panelists across demographic groups, races, and ethnicities. Nielsen’s panel is made up of 58 percent Android and 42 percent iOS users. While we’ve seen the app marketplaces grow, app developers are still continuing to battle to be part of the handful of apps that are being used on a daily basis.
You can read the full report here for more interesting stats.


