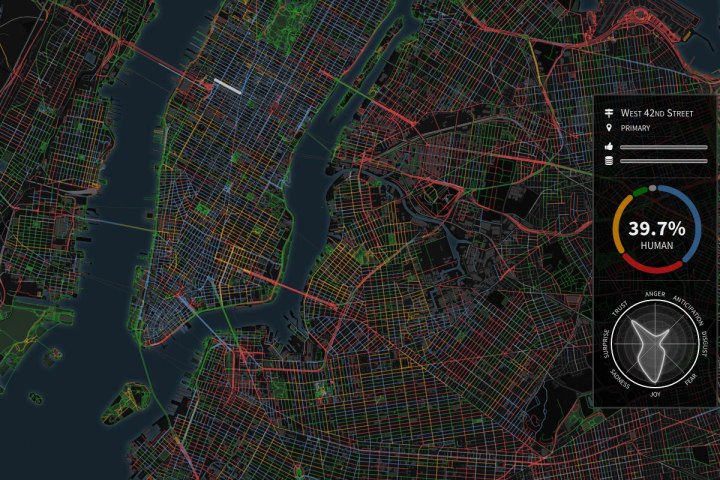
With this in mind, a Europe-based research team comprising three computer scientists and an architect started a project called Chatty Maps to produce beautiful-looking interactive maps that let you see how your city sounds.
The team creates the maps by using software to sift through masses of geotagged Flickr images that’ve also been tagged with sound-related words. The processed data enabled the team to categorize the collected sounds into five distinct groups: transport, nature, human, music, and building (mechanical).
Click on New York City’s Fifth Avenue, for example, and you’ll find the sounds there break down as 41.8 percent human, 23.9 percent mechanical, 14.3 percent transport, 14 percent nature, and 5.9 percent music. In contrast, Riverside Drive, on the west side of Manhattan, shows 81.5 percent nature, 14.2 percent human, 2.7 percent transport, and 1.5 percent mechanical.
Of course, if you visit one of the mapped areas, the sounds you experience are bound to differ according to the time and date you’re there, though Chatty Maps can still offer a general indication of the mixture of noise you can expect.
The photo tags also allowed the team to explore links between sounds and emotions, the results of which accompany each selected street. For example, human-related sounds such as talking and laughing tended to be associated with joy or surprise, while traffic and mechanical sounds were more often linked to anger or fear.
Sounds maps currently exist for 12 cities, including New York, Boston, San Francisco, London, Barcelona, and Rome, with more on their way. Select a city by clicking on the menu on the left of the interface, and use the magnifying glass to zoom in to different neighborhoods or streets.
“Urban sound has a huge influence over how we perceive places,” the team says on its website. “Urban planners and city officials have mostly focused on the negative side of urban sounds, giving little attention to pleasant sounds. Yet, positive sounds have been shown to positively impact city dwellers’ health.”
The project’s main aim is to “empower city managers and researchers to find solutions for an ecologically balanced soundscape,” but perhaps the maps could also prove useful for apartment hunters looking for a tranquil area to live, or help visitors find a quiet spot if ever they need a break from a city’s ear-bashing soundtrack.


